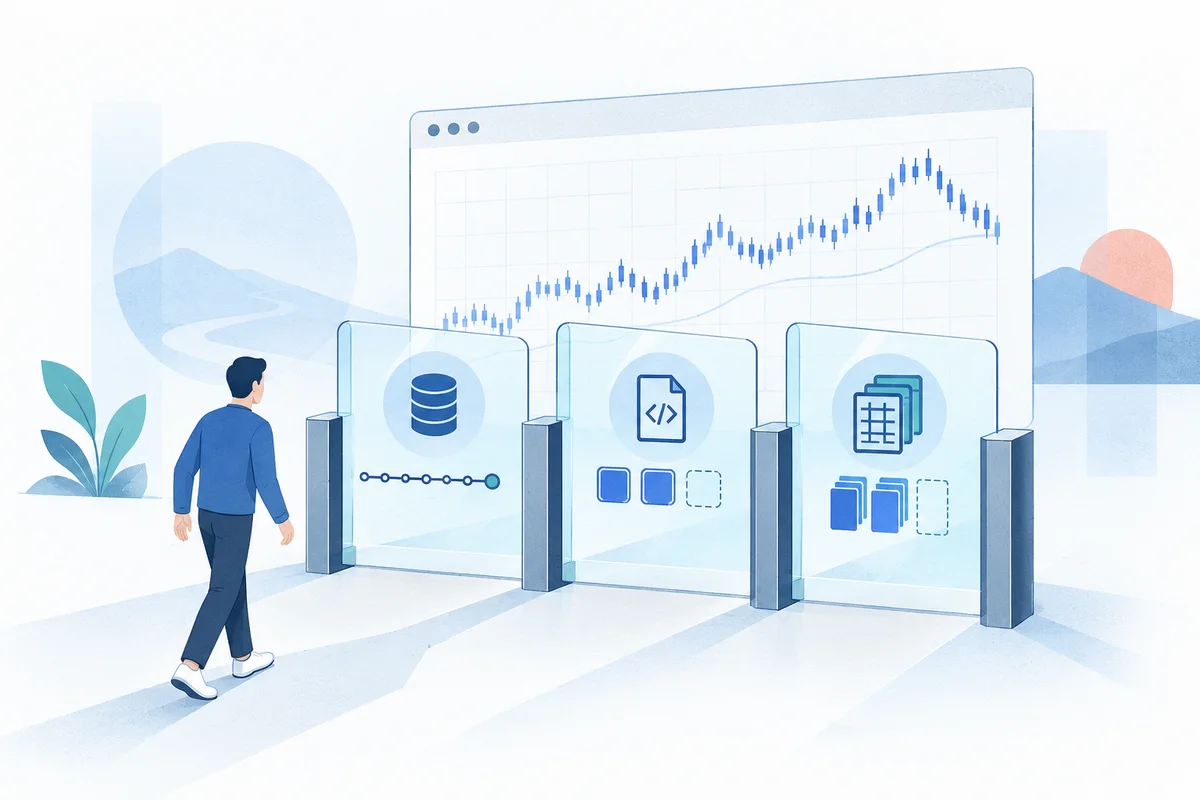
What you actually get on TradingView's free plan
If you are asking whether you can backtest trading strategies on TradingView for free, the short answer is yes, but with severe structural constraints.
TradingView provides access to its automated simulation module—the Strategy Tester—on its entry-level "Basic" (free) plan. Without spending a dollar, any user can:
- Open a web browser and load historical price charts across equities, cryptocurrencies, forex, and commodities.
- Apply hundreds of pre-built or community-contributed technical strategies written in Pine Script.
- Write, modify, and compile custom algorithmic strategies using the Pine Script v5 browser-based code editor.
- View simulated performance metrics in the Strategy Tester tab, including Net Profit, Total Closed Trades, Percent Profitable (Win Rate), Profit Factor, Maximum Drawdown, and a basic simulated equity curve.
- Set up 1 active alert to notify you of strategy entry or exit conditions.
TradingView Free Plan Strategy Tester Interface:
┌────────────────────────────────────────────────────────────────────────┐
│ Candlestick Chart Window (Up to 5,000 historical bars rendered)        │
│ [ ▲ Buy Marker ]                                 [ ▼ Sell Marker ]     │
├────────────────────────────────────────────────────────────────────────┤
│ Strategy Tester Panel:                                                 │
│  • Overview: Net Profit ($), Win Rate (%), Max Drawdown (%)            │
│  • Performance Summary: Basic risk ratios, Sharpe (approximated)       │
│  • List of Trades: Visual paginated list (Export to CSV: LOCKED 🔒)   │
└────────────────────────────────────────────────────────────────────────┘
For retail traders conducting initial visual inspections or discretionary traders checking whether a simple indicator combination generated a positive return on a daily chart over the past decade, this free tier is remarkably frictionless. There is no software to compile, no historical database to configure, and no data cleaning pipeline to maintain.
However, quantitative strategy validation requires rigorous statistical significance, long-horizon multi-regime stress testing, and granular transaction auditing. In these quantitative domains, TradingView's free tier hits rigid commercial and technical ceilings.
The critical bottlenecks for quantitative research
TradingView is primarily a cloud charting and collaborative financial visualization platform, not a dedicated institutional research environment. Its free tier is intentionally engineered to demonstrate platform utility while driving serious traders toward paid monthly subscriptions.
For algorithmic researchers, the free tier introduces four critical bottlenecks that can invalidate an empirical study.
Four Quantitative Roadblocks in Free TradingView:
┌────────────────────────────────────────────────────────────────────────┐
│ 1. 5,000-Bar Depth Cap    │ Truncates intraday tests to weeks/months   │
├───────────────────────────┼────────────────────────────────────────────┤
│ 2. Deep Backtesting Wall  │ Historical computation beyond chart locked │
├───────────────────────────┼────────────────────────────────────────────┤
│ 3. Bar Replay Throttles   │ Intraday tick-by-tick simulation disabled  │
├───────────────────────────┼────────────────────────────────────────────┤
│ 4. Blocked Data Exports   │ No programmatic CSV trade ledger extraction│
└────────────────────────────────────────────────────────────────────────┘
1. The 5,000-bar historical depth cap
On the free Basic plan, TradingView limits historical chart depth to 5,000 bars (compared to 10,000 bars on Essential/Plus plans, and 20,000 to 40,000 bars on Premium/Ultimate plans).
While 5,000 bars sounds generous in the abstract, historical calendar span is a direct function of chart resolution. For higher timeframes, 5,000 bars covers extensive calendar time. But for intraday algorithmic strategies, 5,000 bars is statistically inadequate:
| Resolution | Historical Coverage (5,000 Bars in US Equities: 6.5h / day) | 24/7 Asset Coverage (Crypto / Forex: 24h / day) | Quantitative Viability |
|---|---|---|---|
| 1-Minute (1m) | ~12.8 Trading Days (~2.5 weeks) | ~3.5 Days | Statistically invalid (extreme sample bias) |
| 5-Minute (5m) | ~64 Trading Days (~3.2 months) | ~17.4 Days | Severe regime bias (misses macro cycles) |
| 15-Minute (15m) | ~192 Trading Days (~9.6 months) | ~52.1 Days | High risk (lacks out-of-sample regimes) |
| 1-Hour (1h) | ~769 Trading Days (~3.1 years) | ~208 Days | Marginal (captures 1–2 minor regimes) |
| Daily (1D) | ~5,000 Trading Days (~19.8 years) | ~13.7 Years | Sufficient sample depth for macro trend rules |
Consider an intraday mean-reversion strategy running on a 5-minute chart. On the free tier, your backtest will sample only the past three months of market data. If those three months coincided with a smooth, low-volatility bullish trend, your strategy may show a high Sharpe ratio and low drawdown.
However, you have zero data on how the model performs during a systemic liquidity shock, a stagflationary sell-off, an aggressive interest-rate tightening cycle, or a protracted sideways consolidation. In quantitative finance, testing across 60 days is not a backtest; it is an exercise in recency bias.
Why 5,000 Intraday Bars Fail the Regime Test:
2020 (Crash & V-Recovery) ──> 2021 (Speculative Mania) ──> 2022 (Rate Shock Bear) ──> 2024 (AI Expansion)
                                                                          ▲
                                              [ 5,000 5m bars samples ONLY here! ]
2. The paywall on 'Deep Backtesting'
To address the 5,000 to 10,000 visible bar barrier, TradingView built a feature named Deep Backtesting. Deep Backtesting allows users to calculate Pine Script strategies across decades of historical data without requiring the browser to physically render every individual bar on the chart canvas.
However, Deep Backtesting is completely excluded from the free Basic plan. It requires an active subscription to a paid plan (such as Plus, Premium, or Ultimate).
Even if you are willing to pay for Deep Backtesting, the feature operates as a proprietary, closed-source cloud job:
- Calculations run on remote TradingView servers with strict execution timeouts.
- You cannot debug memory states or variable snapshots bar-by-bar using a native debugger.
- Order matching logic remains a closed proprietary implementation, preventing you from verifying how ambiguous intrabar price sequences are resolved.
3. Bar Replay constraints
Discretionary verification and manual walk-forward audits often rely on TradingView's Bar Replay tool, which rewinds price action and steps through bars one by one to observe indicator and order triggers without hindsight foresight.
On the free plan, Bar Replay is restricted to daily, weekly, and monthly timeframes. Intraday Bar Replay (hourly, 15-minute, or 1-minute playback) is completely disabled. If you want to visually verify why an intraday strategy executed a stop loss during a high-volatility news event, the free plan will not allow you to replay the intraday price action.
4. Data export restrictions and closed ledgers
In an institutional or rigorous quantitative workflow, backtesting output is merely the starting point. Quants export raw transaction ledgers—recording exact execution timestamps, fill prices, order types, slippage deductions, commissions, and running cash balances—to run downstream analyses:
- Monte Carlo simulations and trade-order shuffling.
- Walk-forward parameter surface stability analysis.
- Value-at-Risk (VaR) and Conditional Drawdown distributions.
- Independent tax and transaction cost accounting.
On TradingView's free plan, exporting the Strategy Tester's "List of Trades" to CSV is locked behind a paywall. Free users can only view a truncated, paginated list on screen. Even on paid plans that allow CSV downloads, TradingView provides only aggregated trade summaries, omitting raw tick data, quote bid-ask spreads, and intermediate state variables.
[!WARNING] Without the ability to export an immutable, ticket-level trade ledger into a statistical programming environment, you cannot verify whether your backtested edge is statistically genuine or an artifact of curve-fitting.
Comparative breakdown: Free TradingView vs. Paid TradingView vs. Local Python
To understand where your backtesting infrastructure should live, compare the technical capabilities and structural constraints across TradingView's tiers and a local open-source Python engine like OpenBacktesting:
| Dimension | TradingView Basic (Free) | TradingView Premium / Ultimate (Paid) | OpenBacktesting v0.2.1 (Local Python) |
|---|---|---|---|
| Annual Software Cost | `0 | 700 – 3,600+ / year | `0 (100% Open-Source Apache-2.0) |
| Historical Bar Limit | 5,000 bars visible | 20,000 – 40,000 bars visible | Unlimited (constrained only by disk and RAM) |
| Deep Backtesting | ❌ Not available | ✅ Cloud-only execution (subject to timeouts) | ✅ Native (re-runs across decades locally) |
| Intraday Bar Replay | ❌ Daily / Weekly / Monthly only | ✅ Full intraday resolution replay | ✅ Programmatic stepping bar-by-bar in Python |
| Trade Ledger CSV Export | ❌ Locked behind paywall | ✅ Basic trade list CSV export | ✅ Full programmatic access via pandas DataFrames |
| Custom Tick / Millisecond Data | ❌ Locked to TradingView broker feeds | ❌ Locked to TradingView broker feeds | ✅ Bring any dataset (CSV, Parquet, tick/OHLCV) |
| Execution Engine Transparency | ❌ Closed-source proprietary engine | ❌ Closed-source proprietary engine | ✅ 100% Auditable Python code on GitHub |
| Order Types Supported | Market, Limit, Stop, Stop-Limit | Market, Limit, Stop, Stop-Limit | Market, Limit, Stop, Stop-Limit, Trailing Stop, OCO |
| Parameter Search & Optimization | Manual inputs only | Cloud-based grid scan (limited parameters) | Native Grid Search & SAMBO Bayesian optimization |
| State Persistence | Transient browser session | Cloud strategy settings | Local SQLite database trial persistence |
| Inspection UI | Browser chart overlay | Browser chart overlay | Local OpenBacktesting Studio (zero cloud upload) |
While paid TradingView plans lift visible bar limits to 20,000 or 40,000 bars, they remain closed ecosystems. You cannot feed proprietary alternative data, cannot alter the core matching algorithm, and must pay significant recurring subscription fees.
Why quants transition to open-source Python (OpenBacktesting)
When traders advance from discretionary charting to systematic quantitative development, proprietary platforms quickly become restrictive. This transition leads researchers to open-source, local-first Python frameworks.
OpenBacktesting (version 0.2.1) is an open-source, Apache-2.0 licensed Python framework designed specifically for single-asset historical OHLCV bar-by-bar backtesting. Rather than renting cloud backtesting capacity under recurring paywalls, OpenBacktesting runs entirely on your local machine.
Core advantages of the local Python paradigm:
- Zero Bar and Timeframe Caps: Because execution occurs locally using NumPy and pandas, you can backtest across 500,000 one-minute bars or 20 years of tick-aggregated data without encountering an upgrade prompt.
- Causal Bar-by-Bar Sequencing: Signals evaluated on bar
texecute strictly on subsequent bars (t+1), eliminating lookahead bias and intrabar ambiguity. - Advanced Order Simulation: Native modeling of Market, Limit, Stop, Stop-Limit, Trailing Stop, and OCO (One-Cancels-the-Other) orders, including customizable commission structures (percentage or fixed fees) and deterministic end-of-test liquidation policies (
end_policy="close_at_last_close"). - SQLite Experiment Persistence: Unlike web platforms where parameter variations vanish when you close the tab, OpenBacktesting persists every trial, metric, and parameter set directly to a local SQLite database for historical tracking and auditability.
- Local Studio Visualization: OpenBacktesting includes OpenBacktesting Studio, a local browser-based dashboard that visualizes equity curves, underwater drawdown profiles, and trade distributions without sending proprietary strategy logic or trading logs to third-party cloud servers.
Inspectable Python backtest implementation
Here is a reproducible, self-contained Python backtest demonstrating how OpenBacktesting executes a volatility breakout strategy on historical data with commission modeling, metric reporting, and trade-level ledger export:
import pandas as pd
from openbacktesting import Backtest, Strategy
from openbacktesting.test import GOOG


class VolatilityBreakout(Strategy):
    """
    Classic breakout strategy using Average True Range (ATR)
    and Simple Moving Average (SMA) bands.
    """
    atr_period = 14
    multiplier = 2.0
    sma_period = 20

    def init(self):
        # Calculate technical indicators using integrated pandas-ta-classic
        self.atr = self.ta.atr(self.high, self.low, self.close, length=self.atr_period)
        self.sma = self.ta.sma(self.close, length=self.sma_period)

    def next(self):
        # Guard clause: ensure sufficient warmup history
        if len(self.close) < 25 or self.atr[-1] is None or self.sma[-1] is None:
            return

        upper_band = self.sma[-1] + (self.atr[-1] * self.multiplier)
        lower_band = self.sma[-1] - (self.atr[-1] * self.multiplier)

        # Causal execution logic: signals evaluated at close, filled on subsequent bar
        if not self.position:
            if self.close[-1] > upper_band:
                # Allocate 95% of available portfolio equity
                self.buy(percent=95)
        elif self.close[-1] < lower_band:
            self.position.close()


if __name__ == "__main__":
    # Initialize deterministic bar-by-bar backtest
    bt = Backtest(
        GOOG,
        VolatilityBreakout,
        cash=100_000,
        commission=0.001,  # 0.1% transaction fee per trade
        slippage=0.0005,   # 5 bps estimated fill slippage
        end_policy="close_at_last_close",
    )

    # Execute simulation
    stats = bt.run()

    # Print summary performance metrics
    print("=== Strategy Performance Summary ===")
    print(stats[["Return [%]", "Buy & Hold Return [%]", "# Trades", "Win Rate [%]", "Max. Drawdown [%]", "Sharpe Ratio"]])

    # Extract immutable trade ledger and equity curve as pandas DataFrames
    trades_df: pd.DataFrame = stats["_trades"]
    equity_df: pd.DataFrame = stats["_equity_curve"]

    # Export to CSV for independent statistical verification and Monte Carlo analysis
    trades_df.to_csv("goog_breakout_trades.csv", index=False)
    equity_df.to_csv("goog_breakout_equity.csv", index=True)

    print(f"\nSuccessfully audited {len(trades_df)} closed trades.")
    print("Ledger saved to goog_breakout_trades.csv for downstream validation.")
Notice the critical distinction: at the end of the Python run, your trade log is not trapped behind an interactive web component. It is an in-memory pd.DataFrame containing exact entry/exit timestamps, entry/exit prices, net returns, realized profits, and accumulated commissions.
Decision tree: When is free TradingView enough, and when should you upgrade or switch to Python?
To select the appropriate tool for your current stage of research, evaluate your workflow against this operational decision tree:
                                  [ What is your primary objective? ]
                                                   │
                  ┌────────────────────────────────┴────────────────────────────────┐
                  ▼                                                                 ▼
      [ Discretionary Charting /                                      [ Systematic Quantitative /
        Visual Idea Exploration ]                                       Algorithmic Trading ]
                  │                                                                 │
    [ Do you need > 5,000 bars                                       [ Do you need custom data,
      or intraday bar replay? ]                                        unlimited bars & CSV export? ]
         ┌────────┴────────┐                                               ┌────────┴────────┐
         ▼                 ▼                                               ▼                 ▼
        No                Yes                                             Yes                No
         │                 │                                               │                 │
         ▼                 ▼                                               ▼                 ▼
 ┌───────────────┐ ┌───────────────┐                               ┌───────────────┐ ┌───────────────┐
 │ TradingView   │ │ TradingView   │                               │ Open-Source   │ │ Free Trading- │
 │ Basic (Free)  │ │ Paid Tier     │                               │ Python        │ │ View for rough│
 │ Is Sufficient │ │ (Plus/Premium)│                               │ Framework     │ │ visual checks │
 └───────────────┘ └───────────────┘                               │ (OpenBacktest)│ └───────────────┘
                                                                   └───────────────┘
Scenario 1: Stay on TradingView Free
- You are a discretionary or swing trader executing on daily, weekly, or monthly charts.
- You want to visually inspect whether a classic indicator (e.g., RSI Divergence or Bollinger Bands) showed general predictive alignment over the past 5 to 15 years.
- You do not require algorithmic order execution, custom data imports, or programmatic CSV ledger auditing.
Scenario 2: Upgrade to Paid TradingView
- You have an extensive library of proprietary Pine Script v5 indicators that you do not want to rewrite in Python.
- You require real-time charting across multi-monitor layouts, server-side alerts, and up to 20,000–40,000 visible bars.
- You value cloud synchronization across mobile and desktop devices over raw code inspectability.
Scenario 3: Transition to OpenBacktesting (Python)
- You are developing systematic, high-frequency, or intraday strategies that require hundreds of thousands of historical bars across multiple market regimes.
- You require deterministic order modeling (including Stop-Limit, Trailing Stop, and OCO brackets) with explicit commission and gap-slippage accounting.
- You want to perform rigorous parameter optimization (Grid Search or Bayesian SAMBO) with automatic persistence to local SQLite databases.
- You refuse to be locked into proprietary cloud platforms or pay recurring monthly fees for access to your own research data.
Conclusion and resources
Can you backtest for free on TradingView? Yes, but only for preliminary, high-timeframe visual screening.
The moment your strategy demands intraday granularity, multi-year out-of-sample testing, independent trade ledger auditing, or algorithmic optimization, TradingView's free tier ceases to be a viable research tool. The 5,000-bar limit and data export walls force serious researchers to either pay steep recurring subscription fees or move their modeling into open-source code.
By combining Python's scientific ecosystem with an inspectable, bar-by-bar engine like OpenBacktesting, you gain complete sovereignty over your historical data, execution assumptions, and quantitative findings—without artificial paywalls or cloud limits.
Further reading and documentation:
- Audit TradingView Assumptions: Read our in-depth technical guide on TradingView Backtesting: How to Read the Strategy Tester and Check Assumptions.
- Compare Free Tools: Explore our complete breakdown of tools and execution layers in Free Backtesting Software: Compare Costs, Data, and Limits.
- Get Started with OpenBacktesting: Follow the official OpenBacktesting Quickstart Guide to build, backtest, and audit your first systematic strategy in Python.